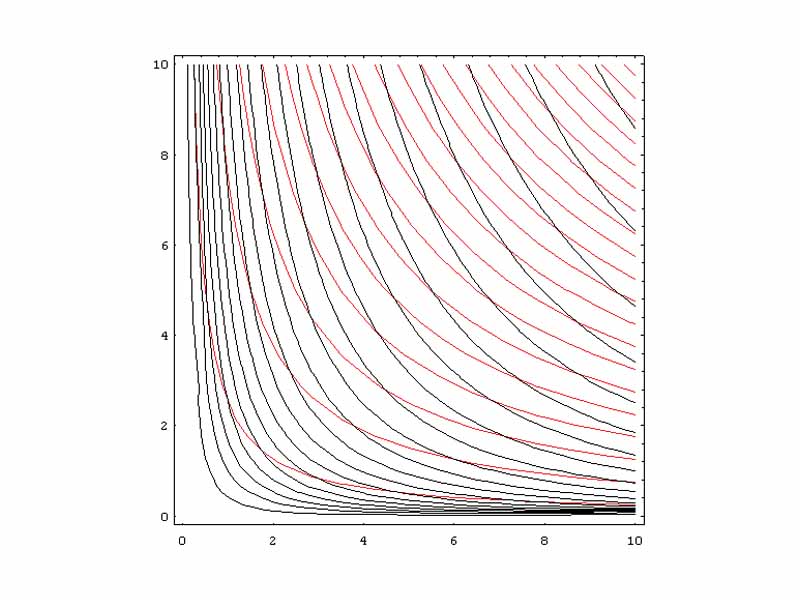
Superposition of Entropy and Temperature Contour Maps (on a P-V diagram). Isotherms are shown as red lines, and adiabats are shown as black lines.
Click this LINK to visit the original image and attribution information. Right click on the image to save the 800px teaching JPEG.